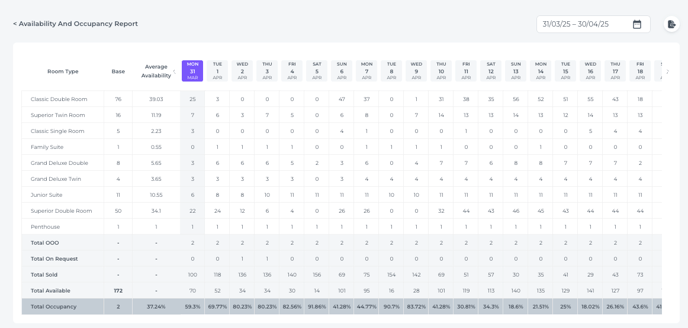
This article provides a detailed explanation of the Availability and Occupancy Report in Noovy. This report offers a comprehensive overview of room availability, occupancy rates, and related data for a specified date range.
Description:
The Availability and Occupancy Report is designed to provide property managers with insights into room availability and occupancy trends. It features the following elements:

- Date Range Selection: The date range for the report can be selected using a date picker, allowing users to analyze data for specific periods (e.g., 31/03/25 - 30/04/25 in the example image).
- Export Options: The report likely includes options to export the data in Excel format for further analysis and sharing.
- Room Type Column: Lists the different room types available at the property (e.g., Classic Double Room, Superior Twin Room, etc.).
- Base Column: Indicates the total number of rooms available for each room type.

- Average Availability Column: Shows the average number of available rooms for each room type over the selected date range.
- Daily Availability Grid: Displays the availability of each room type for each day within the selected date range. The days of the week are indicated (MON, TUE, WED, etc.) along with the corresponding dates.
- Total OOO (Out of Order) Row: Shows the total number of rooms out of order each day.
- Total On Request Row: Shows the total number of rooms requested but not yet confirmed each day.
- Total Sold Row: Shows the total number of rooms sold each day.
- Total Available Row: Shows the total number of rooms available each day.
- Total Occupancy Row: Shows the total occupancy rate for each day, expressed as a percentage.

- Total Occupancy Rate Graph: A bar graph visually representing the daily total occupancy rates. The graph includes:
- X-Axis: Represents the dates within the selected date range.
- Y-Axis: Represents the occupancy rate percentage (0% to 120%).
- Bars: Each bar corresponds to a specific date and its height represents the occupancy rate for that day.
- Data Labels: The occupancy rate percentage is displayed above each bar.
Key Metrics and Calculations:
- Average Availability: Calculated by summing the daily availability for each room type and dividing by the number of days in the selected date range.
- Total Occupancy: Calculated as (Total Sold / Total Available) * 100%.

How to Generate and Interpret the Report:
- Navigate to the Reports Section: Access the "Reports" section.
- Select - Availability: Choose the "Availability and Occupancy Report" option.
- Specify the Date Range: Use the date picker to select the desired start and end dates for the report.
- Generate the Report: Click the "Export" button to create the report.

- Analyze the Data:
- Room Type Analysis: Review the Average Availability and daily availability for each room type to identify trends and potential issues.
- Occupancy Rate Analysis: Analyze the Total Occupancy row and the Total Occupancy Rate Graph to understand the overall occupancy rate and identify peak and low periods. The graph provides a quick visual understanding of occupancy trends.
- Total OOO and On Request: Monitor these rows to understand the impact of out-of-order rooms and pending requests on availability.
- Export the Report (Optional): Export the report in Excel format for further analysis or sharing.
Interpreting the Total Occupancy Rate Graph:
- Peak Periods: High bars on the graph indicate periods of high occupancy.
- Low Periods: Low bars on the graph indicate periods of low occupancy.
- Trends: The graph helps visualize trends in occupancy over the selected date range.
Troubleshooting:
- Data Discrepancies: If you notice any discrepancies in the data, ensure that the date range is correct and that all room data is accurately entered into the system.
- Report Generation Issues: If you encounter issues generating the report, please contact our support team at support@noovy.com or + 31 20 532 1781.
- Graph Display Issues: If the graph is not displaying correctly, ensure your browser is up-to-date and that JavaScript is enabled.
Note:
- The Availability and Occupancy Report, including the Total Occupancy Rate Graph, is a valuable tool for optimizing room inventory and maximizing revenue.
