The Pick-Up report shows the net change in future reservations, so you can see each day how many bookings are added or cancelled.
Analyzing the Report:
-
Booking Pace: A clear view of how bookings change for upcoming dates—whether reservations build steadily or last-minute cancellations increase.
-
Identify Trends: Look for booking patterns by weekday or season. Spotting periods with higher bookings or cancellations helps you adjust strategies in advance.
-
Revenue Management: Use the report’s insights to adjust pricing and availability. If bookings surge for a date, increase rates; if cancellations rise, add targeted discounts or offers to support occupancy.
The Pick up report can be found from the main menu under Reports :

Run the Report
- In the date range field, select the period for which you wish to analyse pick-up details:

Report Overview:
Columns explained

-
-
Occ (Occupancy) – Reflects the percentage of rooms occupied during the period selected in the date range field.
-
Rev (Revenue) – Displays the total revenue generated during the selected period.
-
ADR (Average Daily Rate) – The average room revenue earned per occupied room during the selected period.
-
PU 1D – Shows the net change in reservations compared to the previous day. For example, a value of "1" on 25 January indicates one additional reservation was recorded since 24 January, after accounting for new bookings and cancellations.
-
PU 3D – Displays the net change in reservations for that date compared to three days prior.
-
PU 7D – Displays the net change in reservations for that date compared to seven days prior.
-
PU 14D – Displays the net change in reservations for that date compared to 14 days prior.
-
PU 21D – Displays the net change in reservations for that date compared to 21 days prior.
-
PU 30D – Displays the net change in reservations for that date compared to 30 days prior.
-
📝 Note:
A positive value in any ‘PU’ column indicates that new bookings exceeded cancellations, resulting in a net increase in reservations.
Conversely, a negative value indicates that cancellations outweighed new bookings, reflecting a net decrease.
-
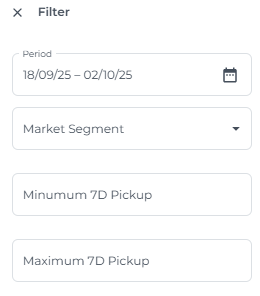
Filter:
Apply filters to focus on the data most relevant to your requirements

-
Market Segment:
If market segments have been set up in your PMS (such as business or leisure travelers), use this filter to view pick-up trends specific to each segment.
-
-
- Minimum 7D Pickup:
Enter a value in this field to display only those dates where the net pick up over the past 7 days meets or exceeds your specified threshold. This allows you to highlight periods of strong booking momentum. -
Maximum 7D Pickup:
Enter a value to show only dates where net 7-day pickup is at or below your threshold, helping you spot slower periods or higher cancellations.
- Minimum 7D Pickup:
- Click "Save" to apply your filter selections.
- Click “Reset” to remove all filters and display the complete report.
