Analyzing the Report:
- Booking Pace: This report provides a clear view of how booking activity evolves for upcoming dates. Are reservations increasing steadily as the stay date approaches, or are you noticing a surge in last-minute cancellations?
- Identify Trends: Look for booking patterns by day of the week or seasonality. Are there specific periods when bookings increase or cancellations spike? Identifying these trends can help you proactively adjust your strategies.
- Revenue Management: Leverage the report’s insights to fine-tune your pricing and availability strategies. Noticing a surge in bookings for a certain date? Adjust rates upward to maximize revenue. If cancellations are trending higher, consider introducing targeted discounts or special offers to stimulate bookings and maintain occupancy.
The Pick up report can be found from the main menu under Reports :

- In the date range field, select the period you wish to analyze pick-up details for:

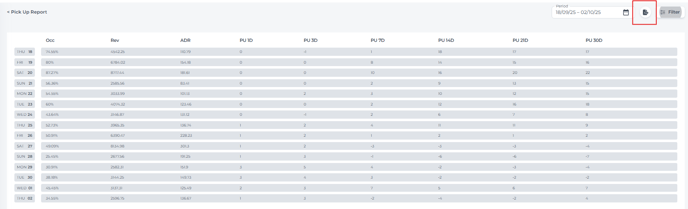
Report Overview, columns explained: 
-
- Occ - Occ: Indicates Occupancy and reflects the percentage of rooms occupied for the period selected in the date range field.
- Rev - Displays the total revenue generated during the selected period.
- ADR - Represents the Average Daily Rate, reflecting the average room revenue earned per occupied room during the selected period.
- PU 1D - Shows the net change in reservations for that date compared to the previous day. For example, a value of "1" on January 25th means there was one more reservation for that date as recorded on January 24th, accounting for new bookings and any cancellations.
- PU 3D - Displays the net change in reservations for that date compared to three days prior, accounting for all new bookings and cancellations recorded in that period.
- PU 7D - Displays the net change in reservations for that date compared to seven days prior, accounting for all new bookings and cancellations recorded in that period.
- PU 14D - Displays the net change in reservations for that date compared to fourteen days prior, accounting for all new bookings and cancellations recorded in that period.
- PU 21D - Displays the net change in reservations for that date compared to twenty-one days prior, accounting for all new bookings and cancellations recorded in that period.
- PU 30D - Displays the net change in reservations for that date compared to thirty days prior, accounting for all new bookings and cancellations recorded in that period.
📝Note:
A positive value in any "PU" column means there were more bookings than cancellations—resulting in a net increase in reservations.
Conversely, a negative value indicates more cancellations than bookings, reflecting a net decrease in reservations.
Apply filters to focus on the specific data most relevant to your analysis:

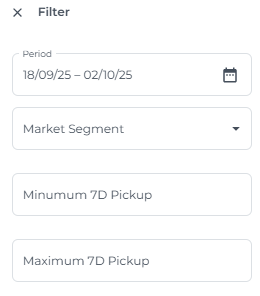
- Market Segment:
If market segments have been set up in your PMS (such as business or leisure travelers), use this filter to view pick-up trends specific to each segment. - Minimum 7D Pickup:
Enter a value in this field to display only those dates where the net pick up over the past 7 days meets or exceeds your specified threshold. This allows you to highlight periods of strong booking momentum. - Maximum 7D Pickup:
Enter a value in this field to show only dates where the net pick up over the past 7 days is less than or equal to your specified threshold. This filter helps you pinpoint periods with slower booking momentum or increased cancellations—enabling you to quickly identify dates that may require attention or intervention. - Click "Save" to apply your filter selections.
- Click “Reset” to remove all filters and display the complete report.
💡Tip:
You can export the report in either Excel or PDF format for easy sharing and further analysis: